What Drives Routine Vaccine Availability at Health Facilities?

OR 68, 8-10 September, Nottingham

Bahman Rostami-Tabar

Data Lab for Social Good, Cardiff Business School, Cardiff University, UK

Daniel Brigden

World Health Organization (WHO), Geneva, Switzerland

Vaccines are among the most effective public-health interventions
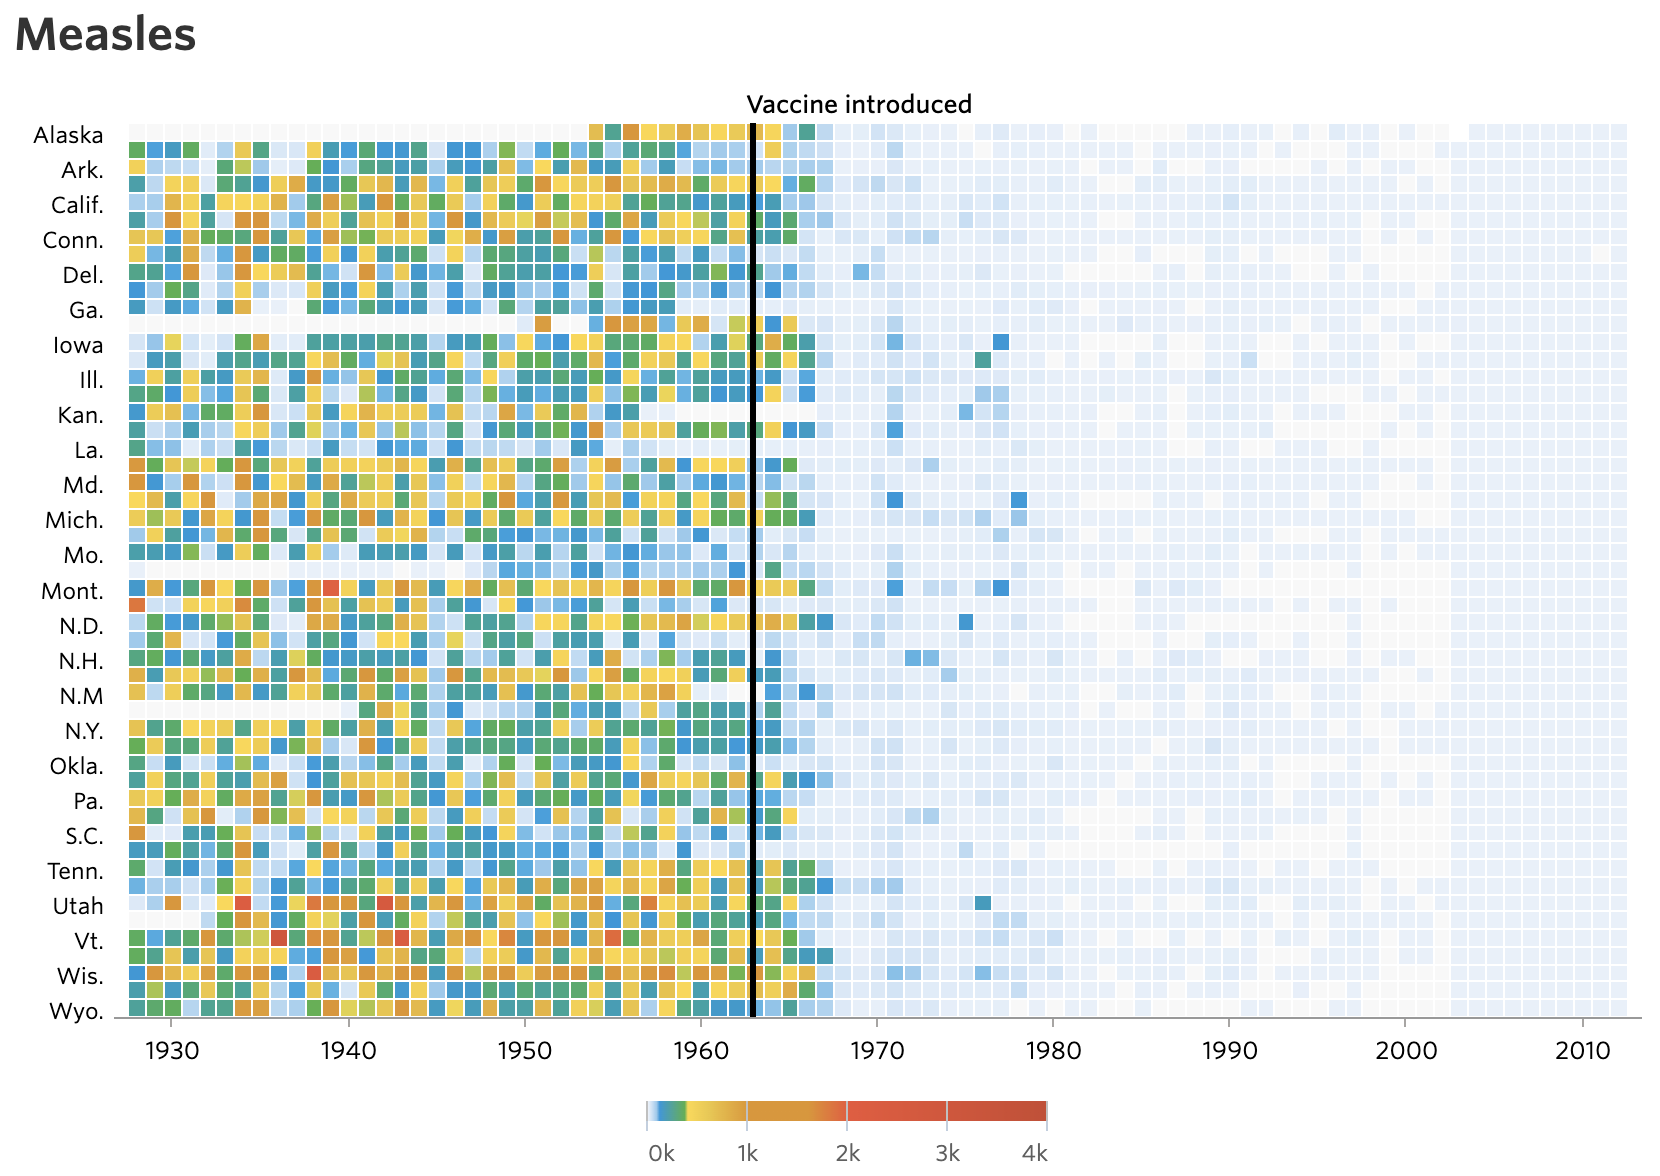
Vaccines are among the most effective public-health interventions
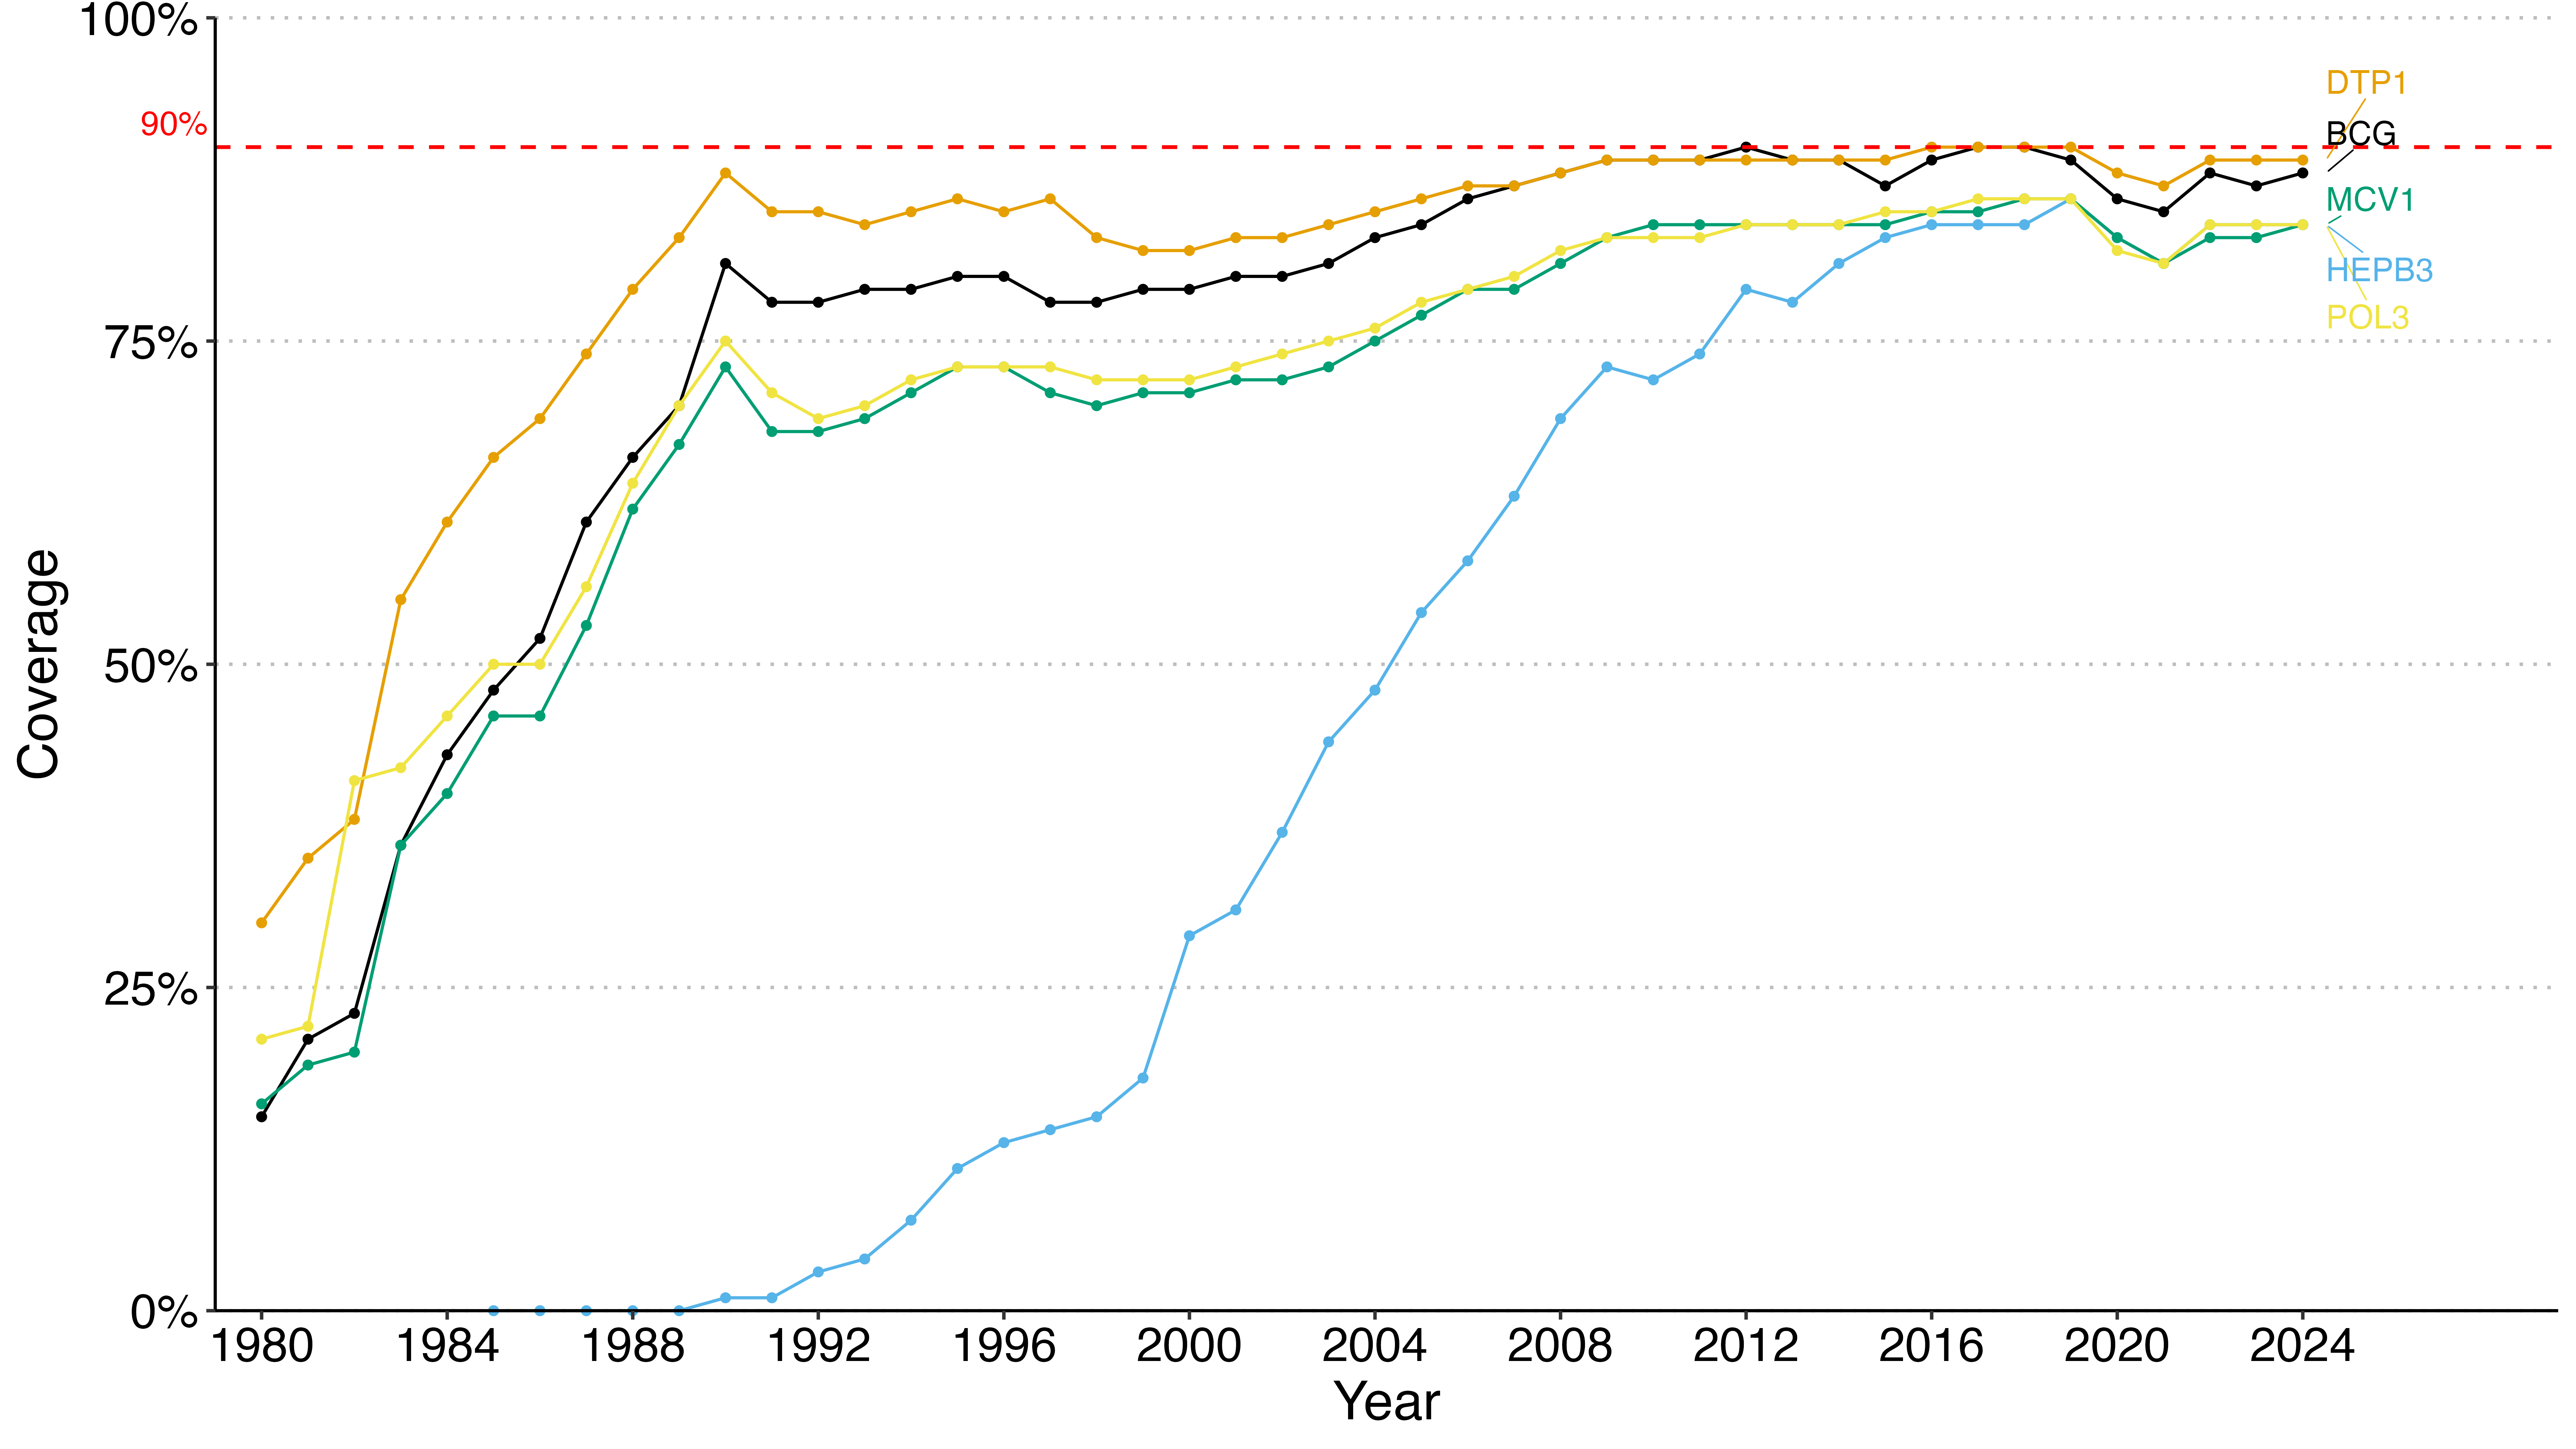
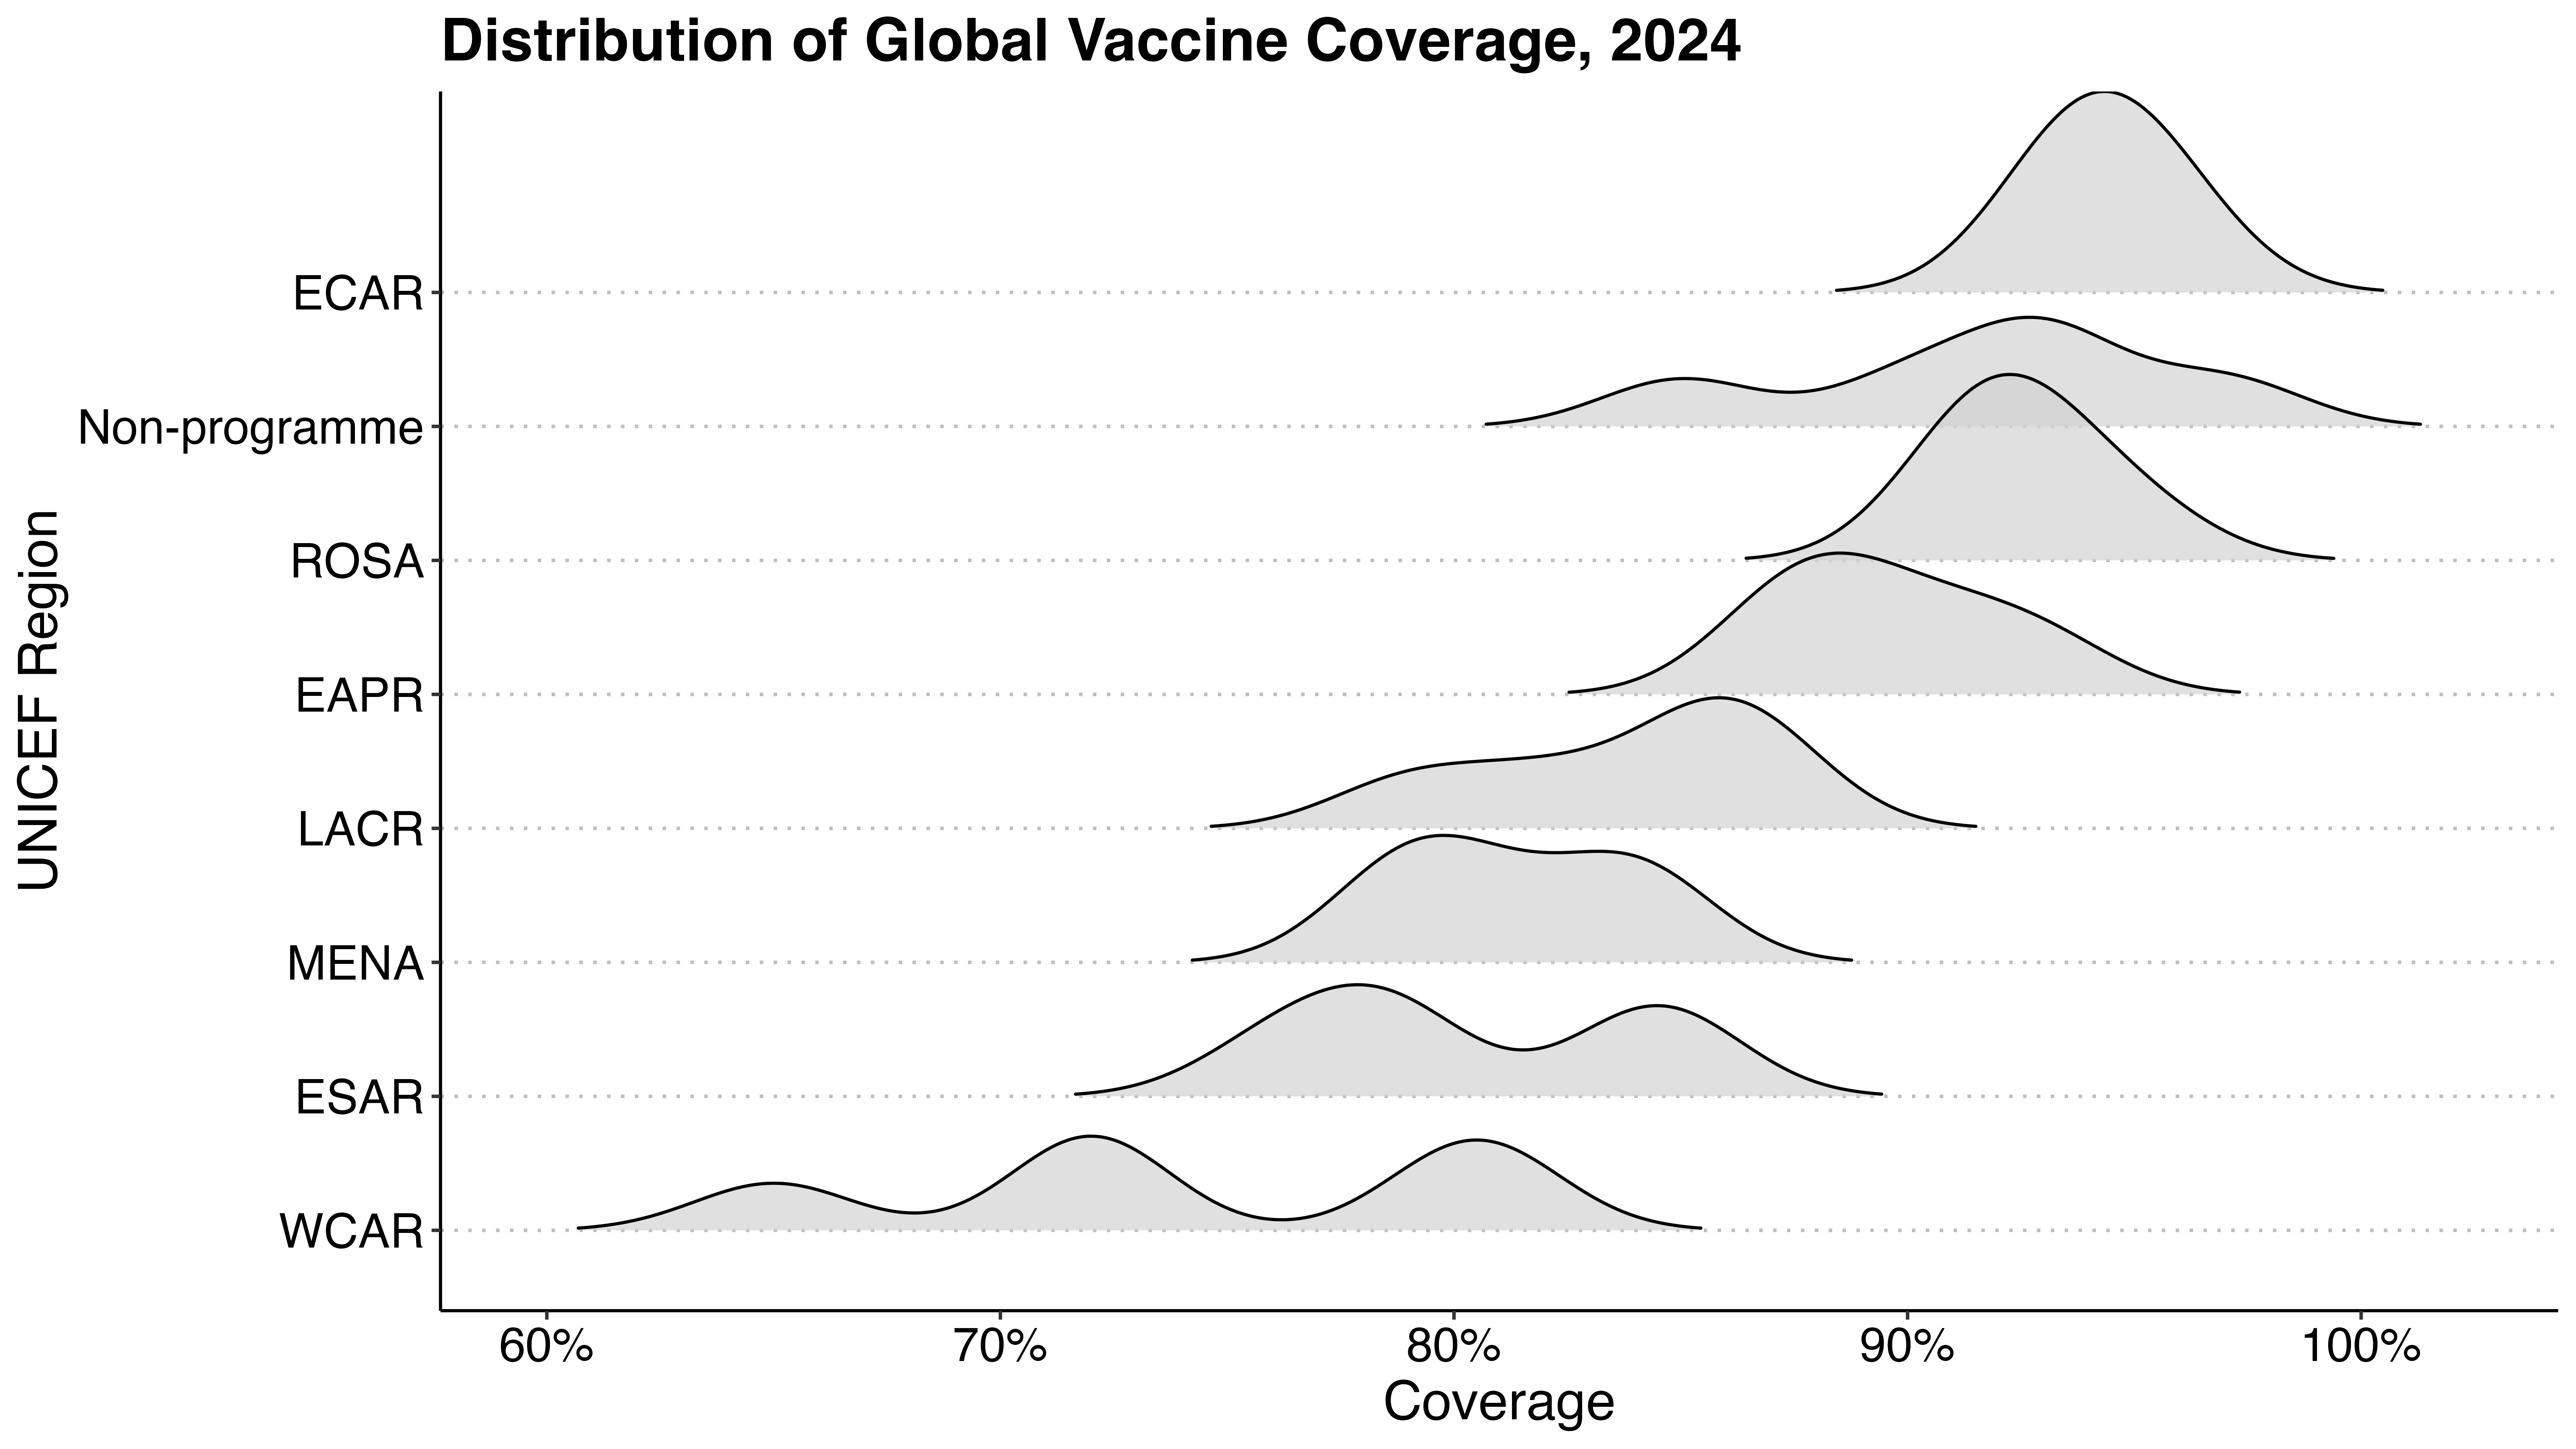
Coverage disparities exist within and between regions
19.9 Million

Missed vaccines

13.5 Million

Zero-dose

4.9 Million

Under-five mortality

Having the vaccine is not enough

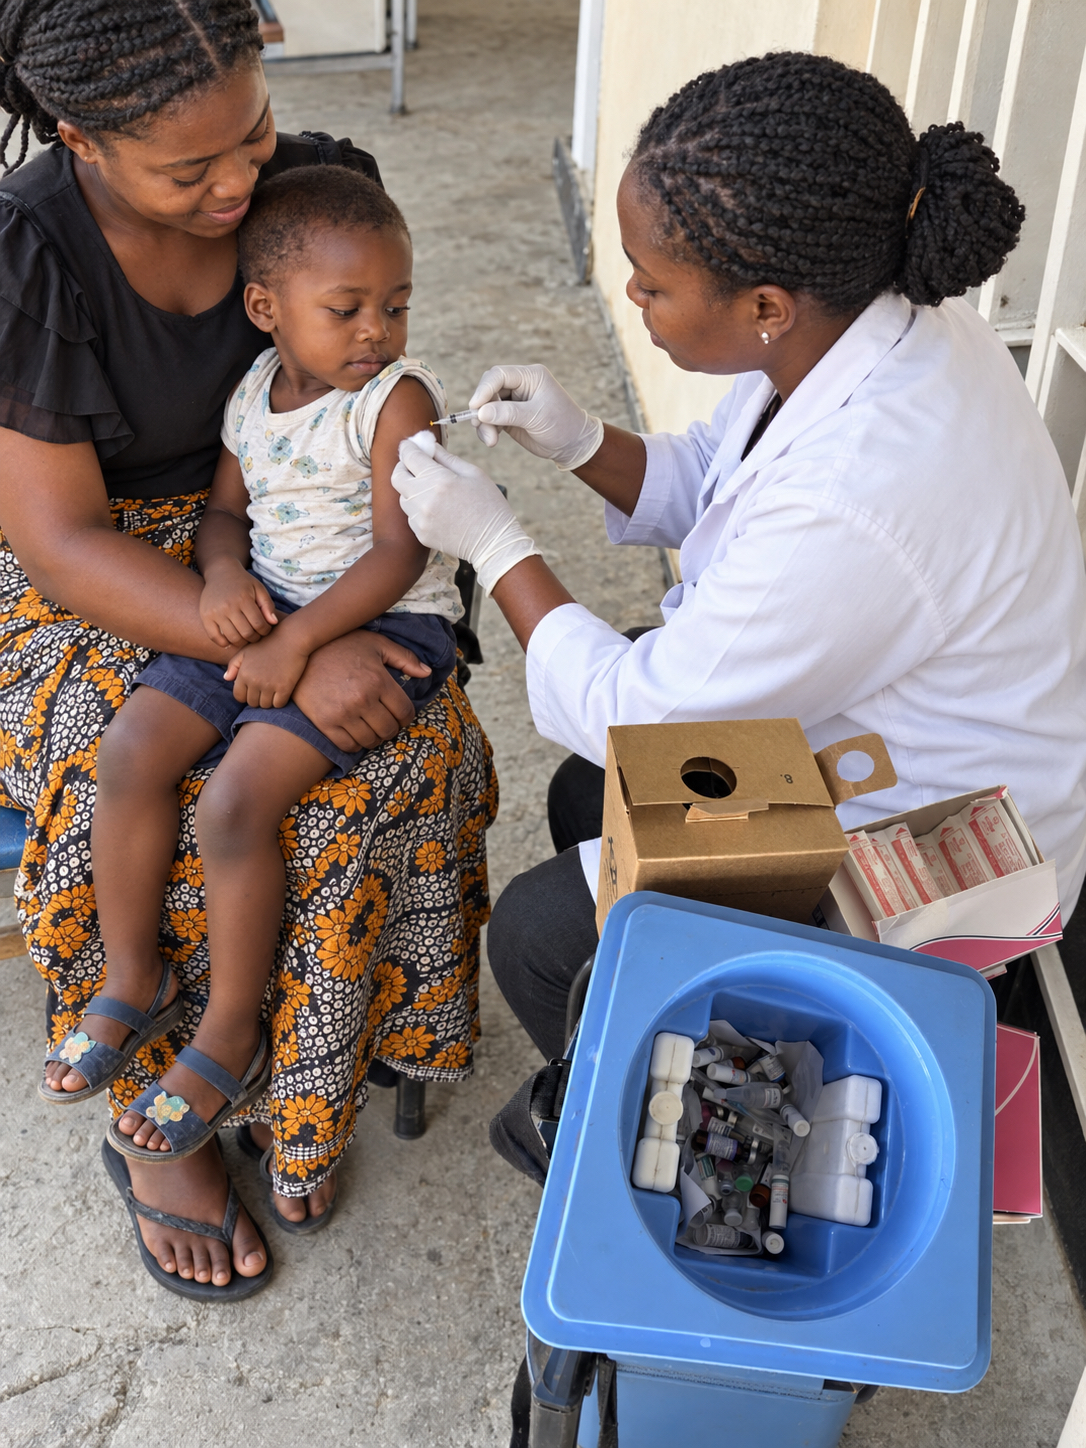
A vaccine only saves a life if it reaches the child.
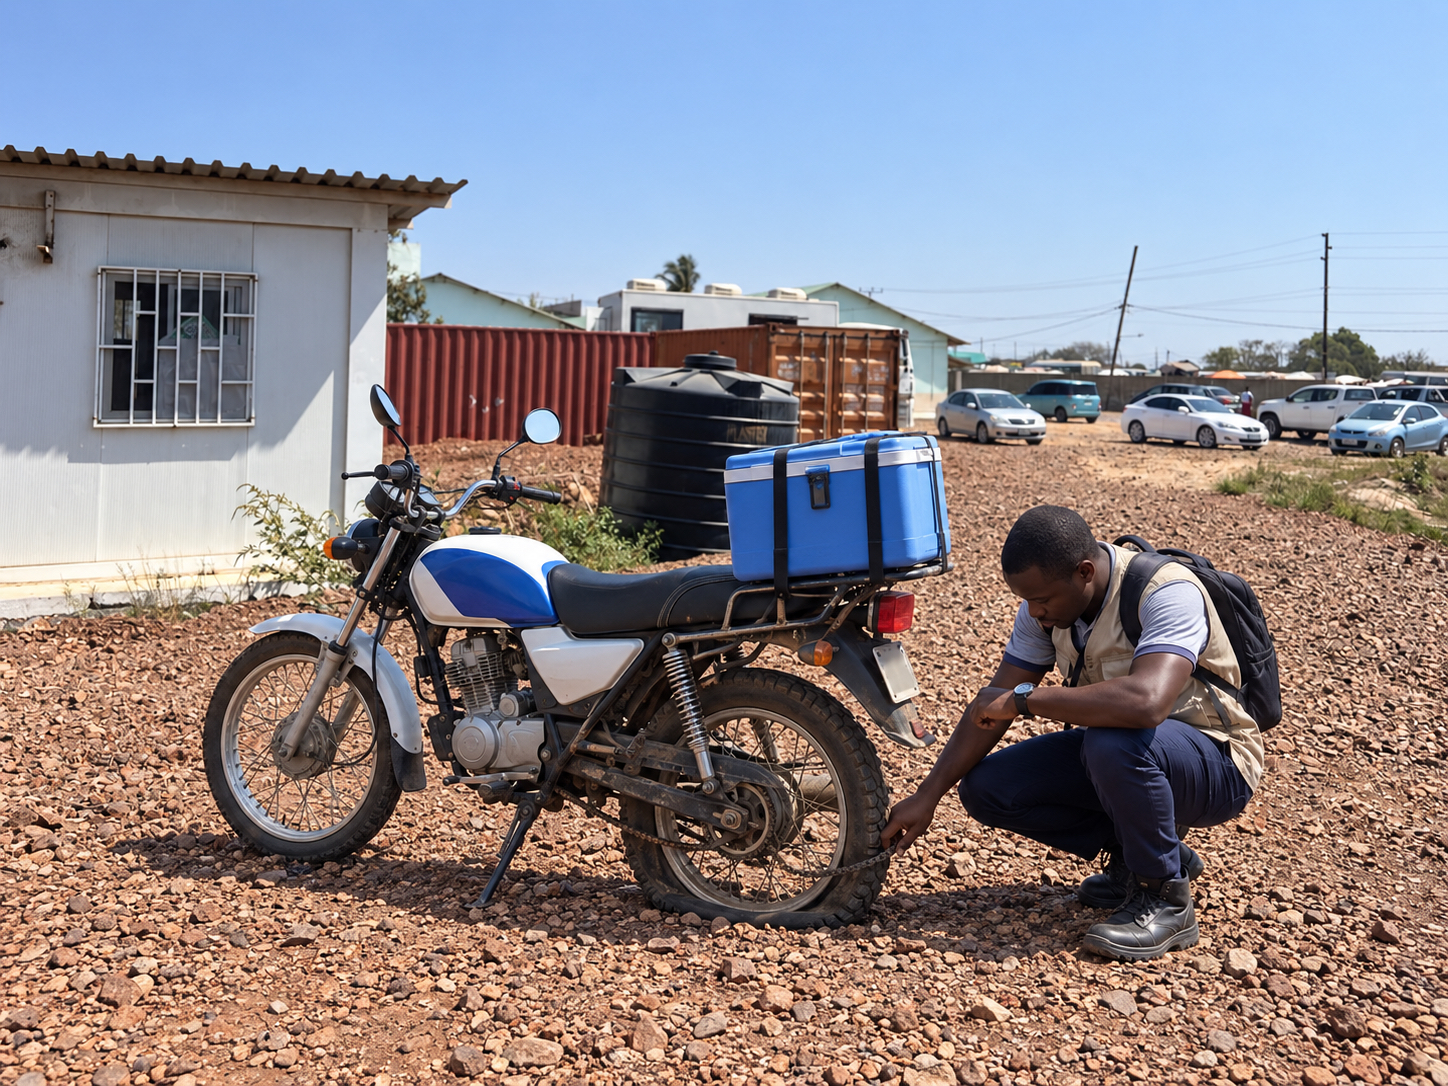
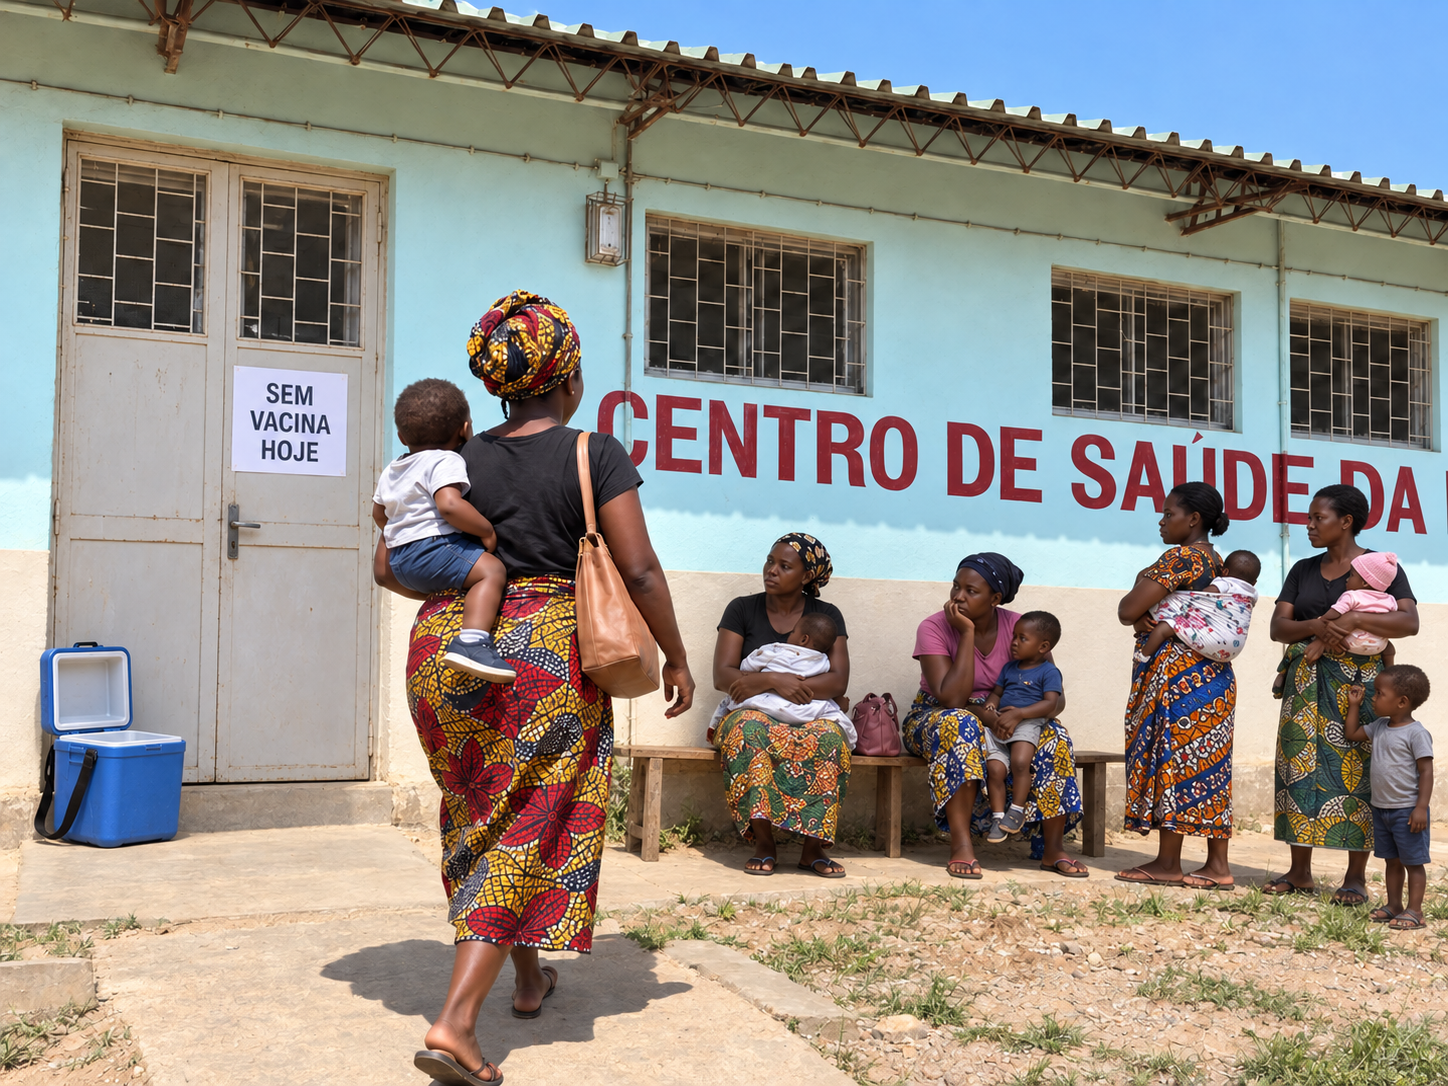
What could have gone wrong?

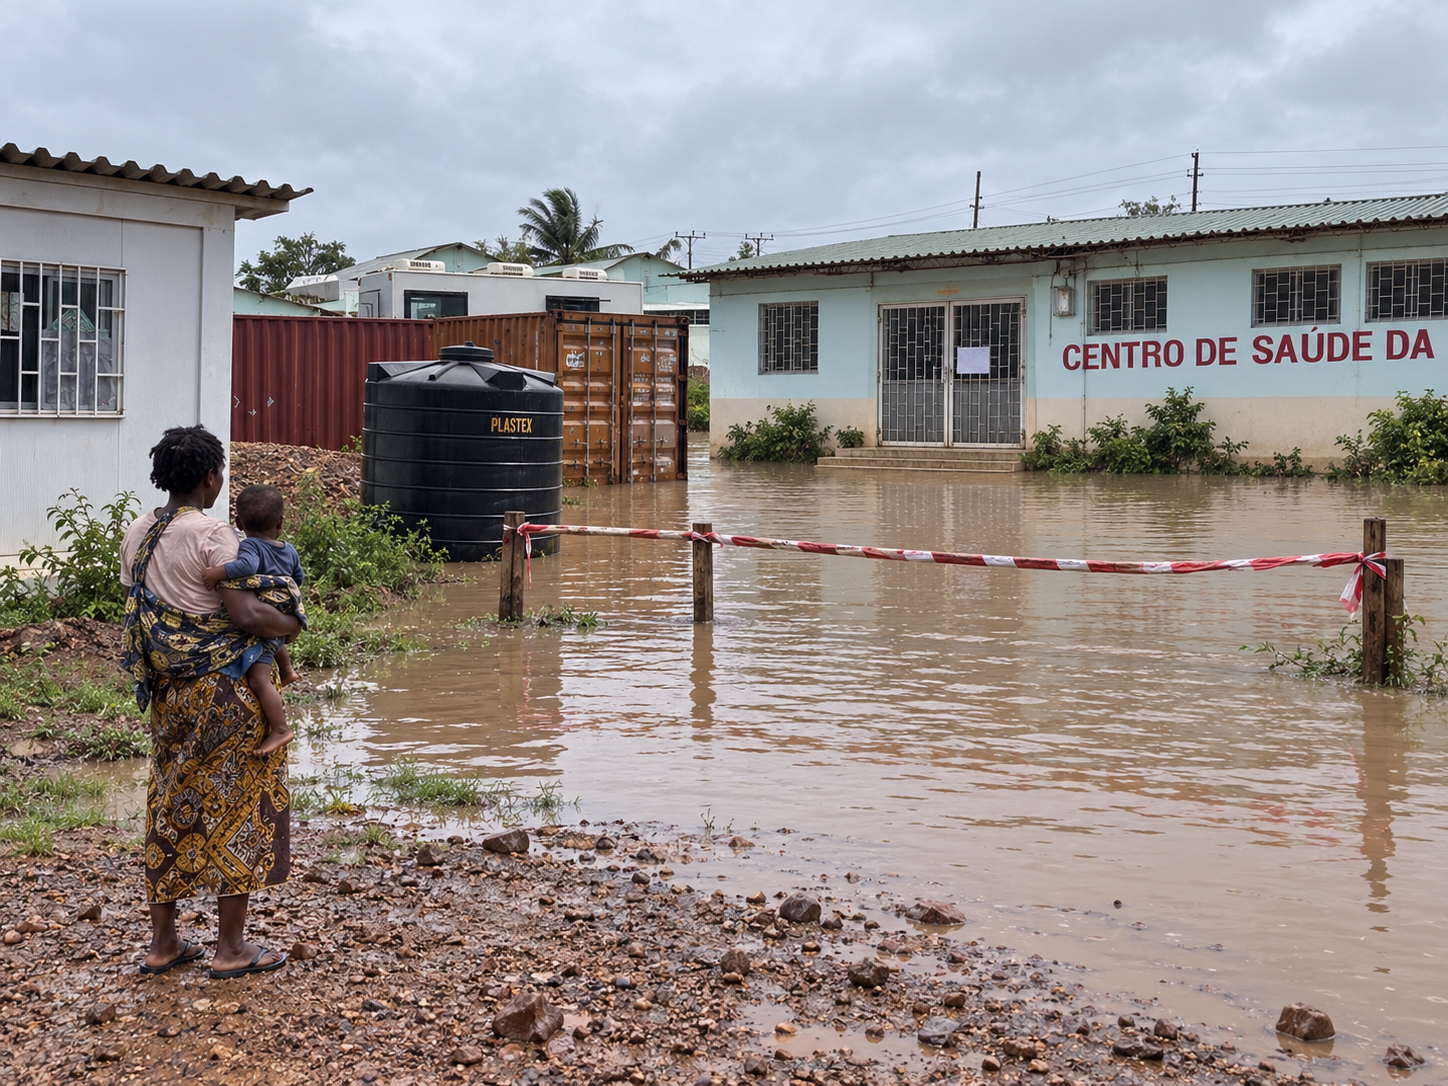
The child arrives. But the vaccine is not available. Why?
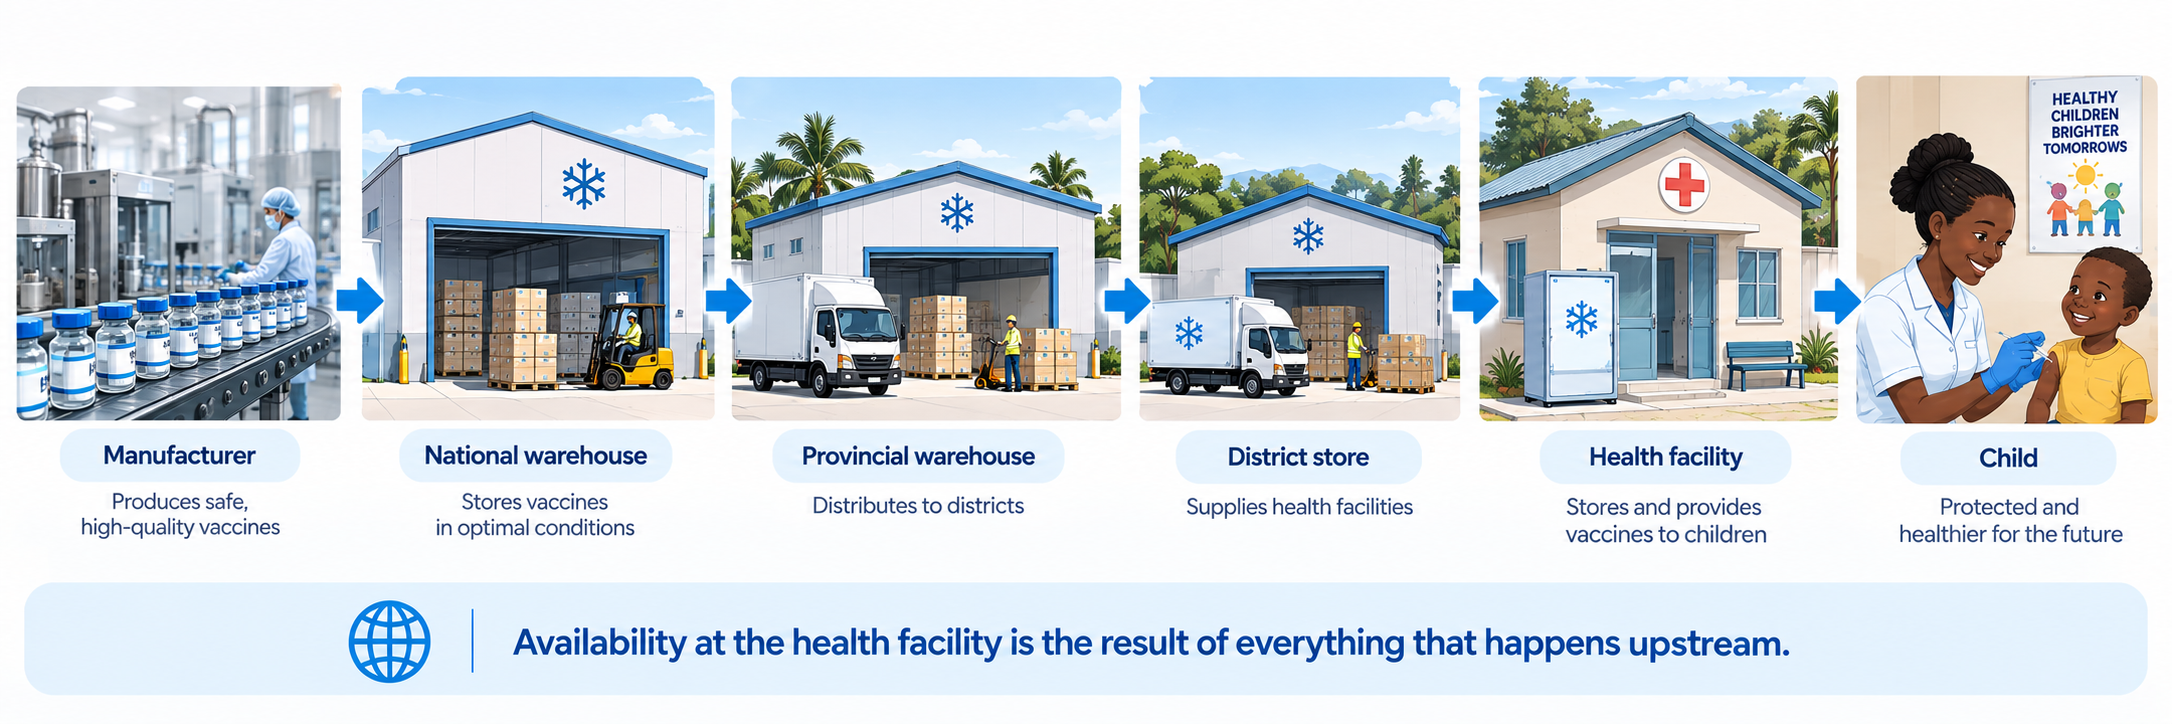
Availability depends on a whole set of capabilities working together

The supply chain connects vaccines to health outcomes
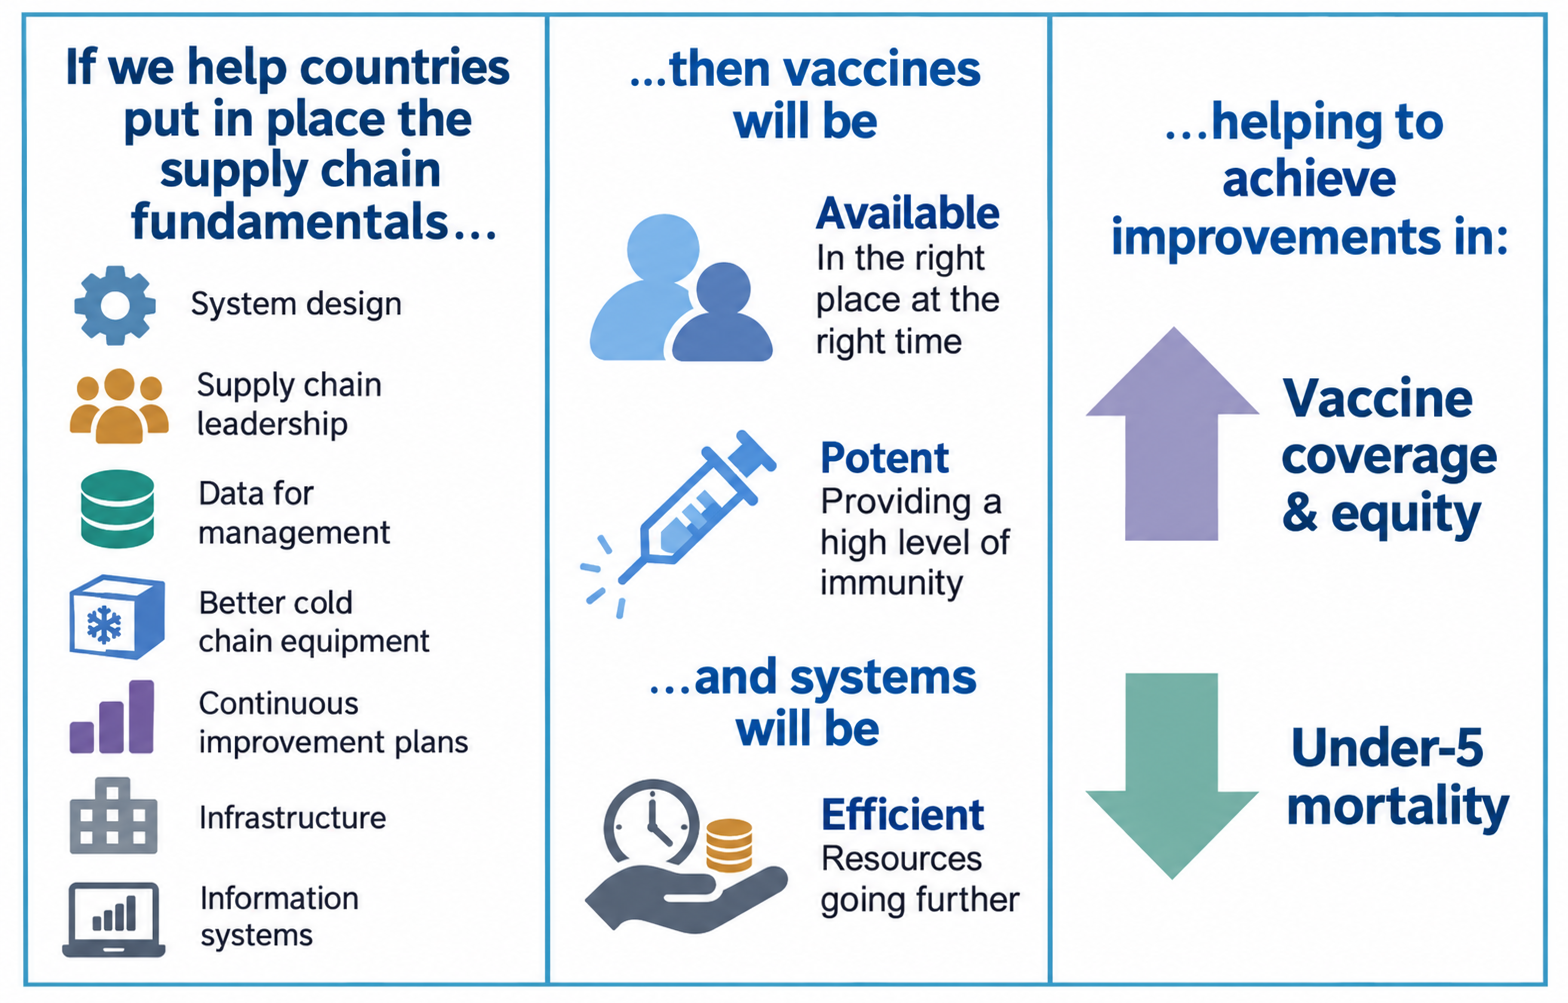
How do we actually know whether these supply-chain capabilities are in place and working?”

A global initiative to improve immunisation supply chain

A national planning process endorsed and supported by WHO and UNICEF

Effective Vaccine Management (EVM) provides materials and tools needed to monitor and assess vaccine supply chains and help countries improve their supply chain performance.

Outline

  • EVM framework and data

  • From EVM assessment to analytics

  • What drives vaccine availability?

  • Implications for immunisation supply chains

  • Future work

EVM Framework

The EVM assessment framework defines the way in which vaccine supply chain systems are assessed.

It is organised by:

  • Questions: are asked to assess whether a requirement has been met.
  • Requirements: the attributes that a well-functioning immunisation supply chain must have.
  • Requirements could be inputs, outputs or performance measures.
  • Criteria: the operational or management functions that health facilities must perform.
  • Categories: the necessary inputs, outputs and performance of health facilities.
  • Assessments from 82 countries between 2019 and 2026
  • 1286 potential questions
  • Over 4000 health facilities
  • 900 requirements, 19 criteria and 8 categories
  • Scores range from 0 to 5

Data - Scores

EVM creates an analytical opportunity

EVM already tells us where requirements are being met.

But we want to go one step further:

Which facility requirements are associated with vaccine availability, in which direction, and how strongly?

We focus on Service Point (SP) facilities

  • Outcome: Vaccine availability (AV)

  • Independent variables of interest: The facility’s EVM requirements.

  • Context: Country and target population are used as adjustments rather than treated as the requirements of interest.

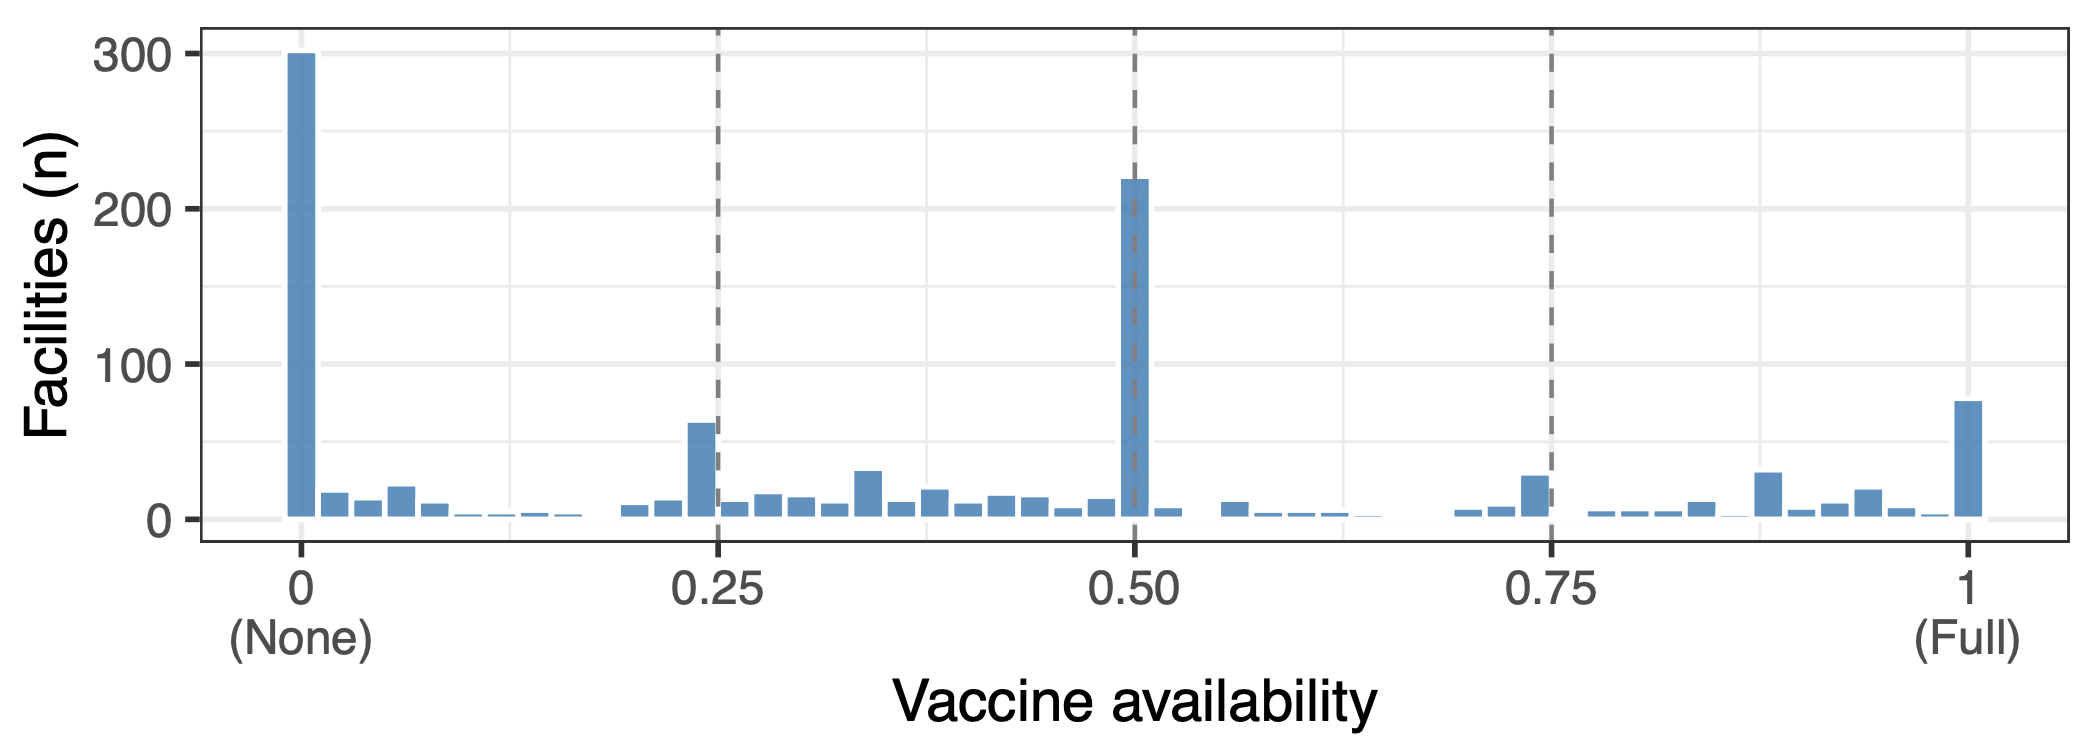
Availability is categorized and ordered

Band Availability
1 — None AV = 0
2 — Critical 0 < AV ≤ 0.25
3 — Low 0.25 < AV ≤ 0.50
4 — Moderate 0.50 < AV ≤ 0.75
5 — Good 0.75 < AV < 1
6 — Full AV = 1

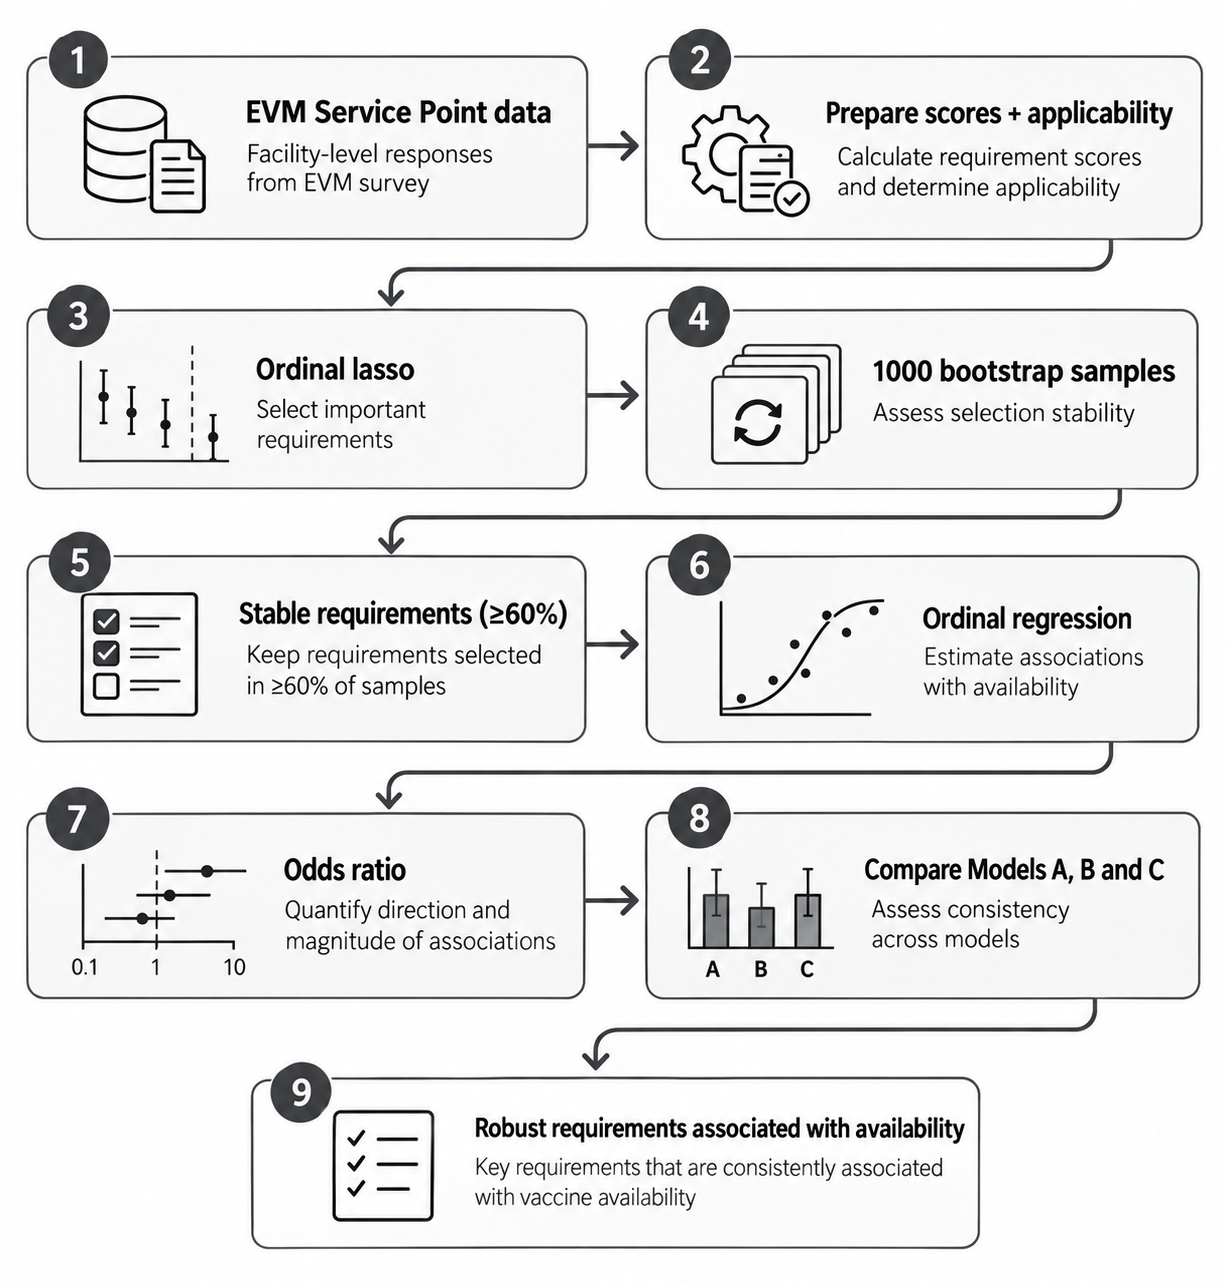
The analytical workflow

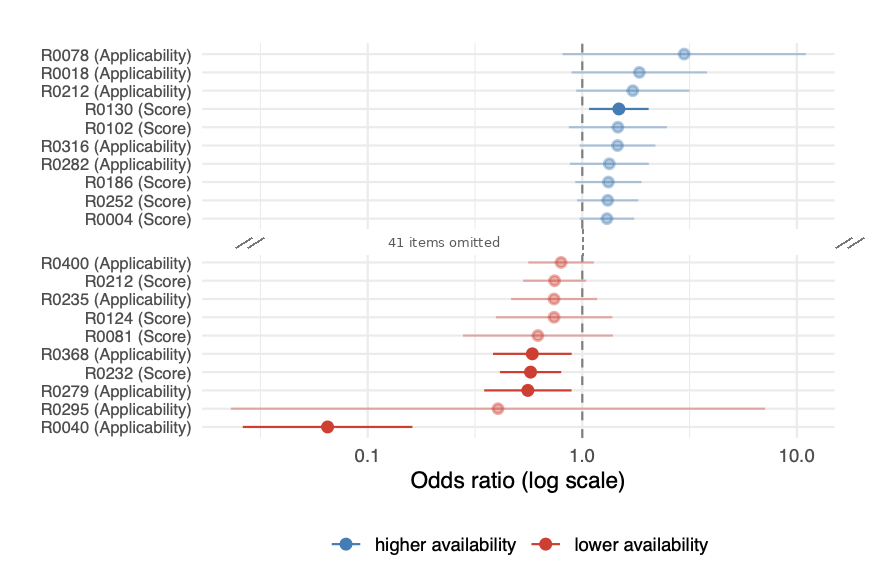
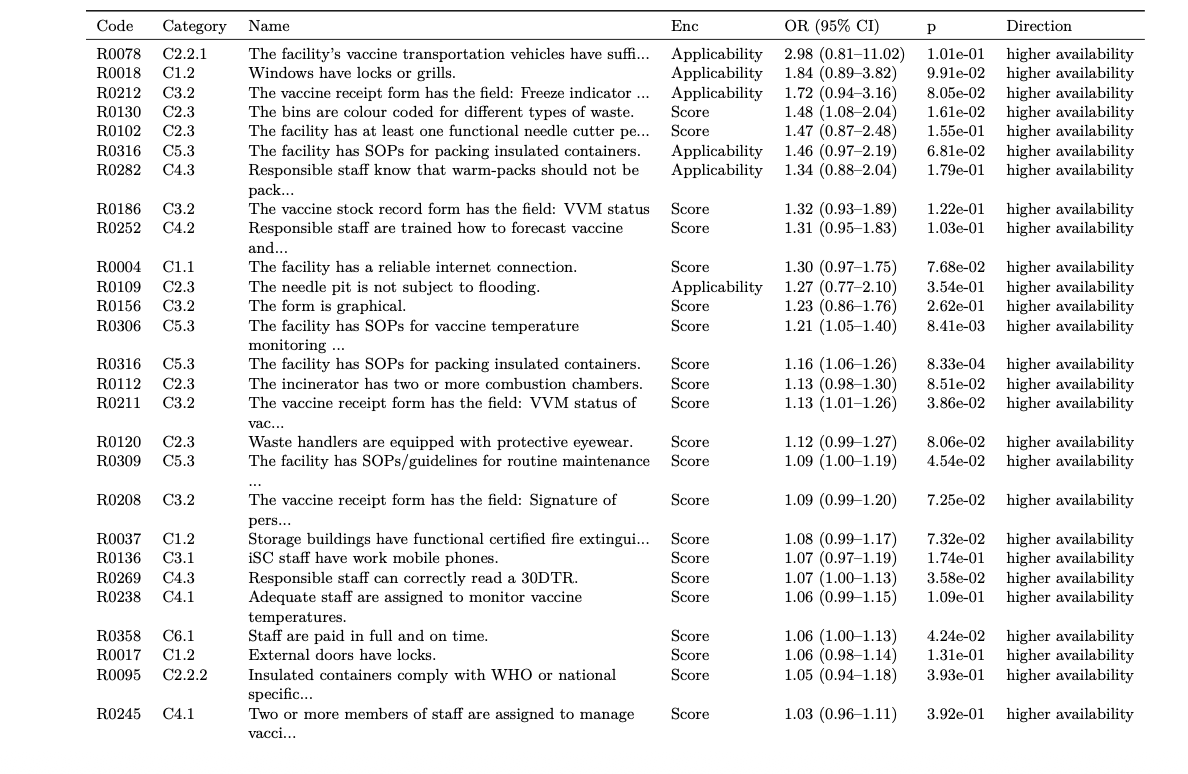
Results

Results
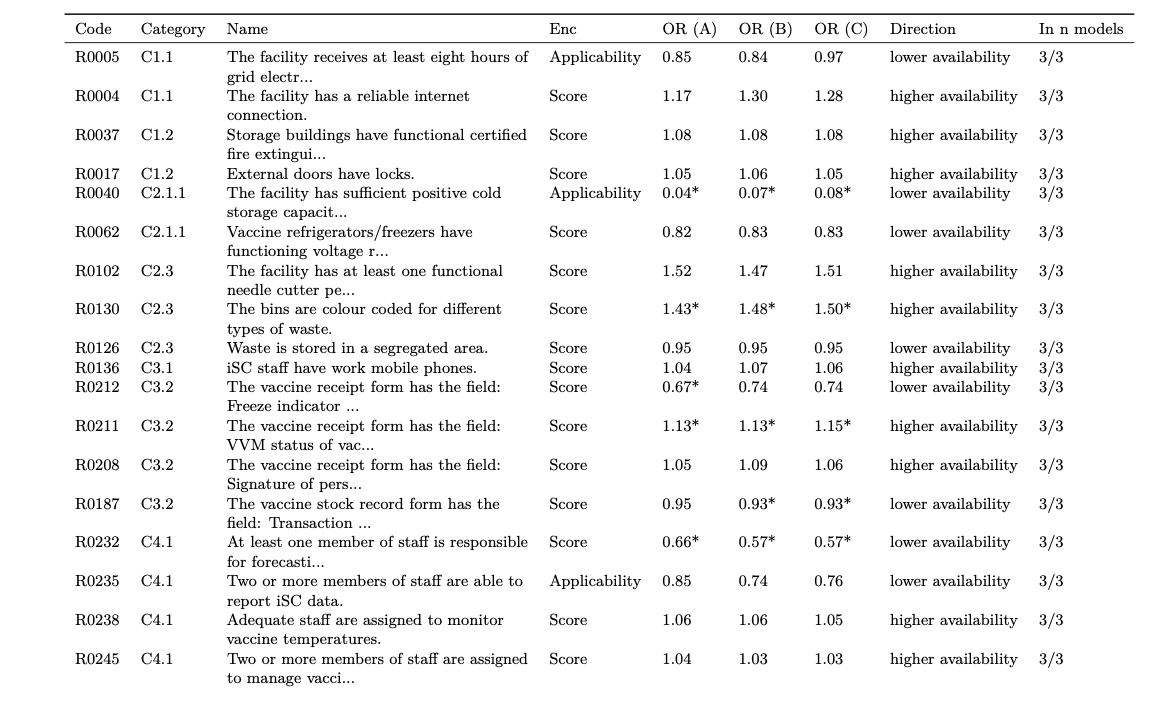
Agreement across models is the robust core

A requirement that changes direction or disappears across specifications should be treated more cautiously.
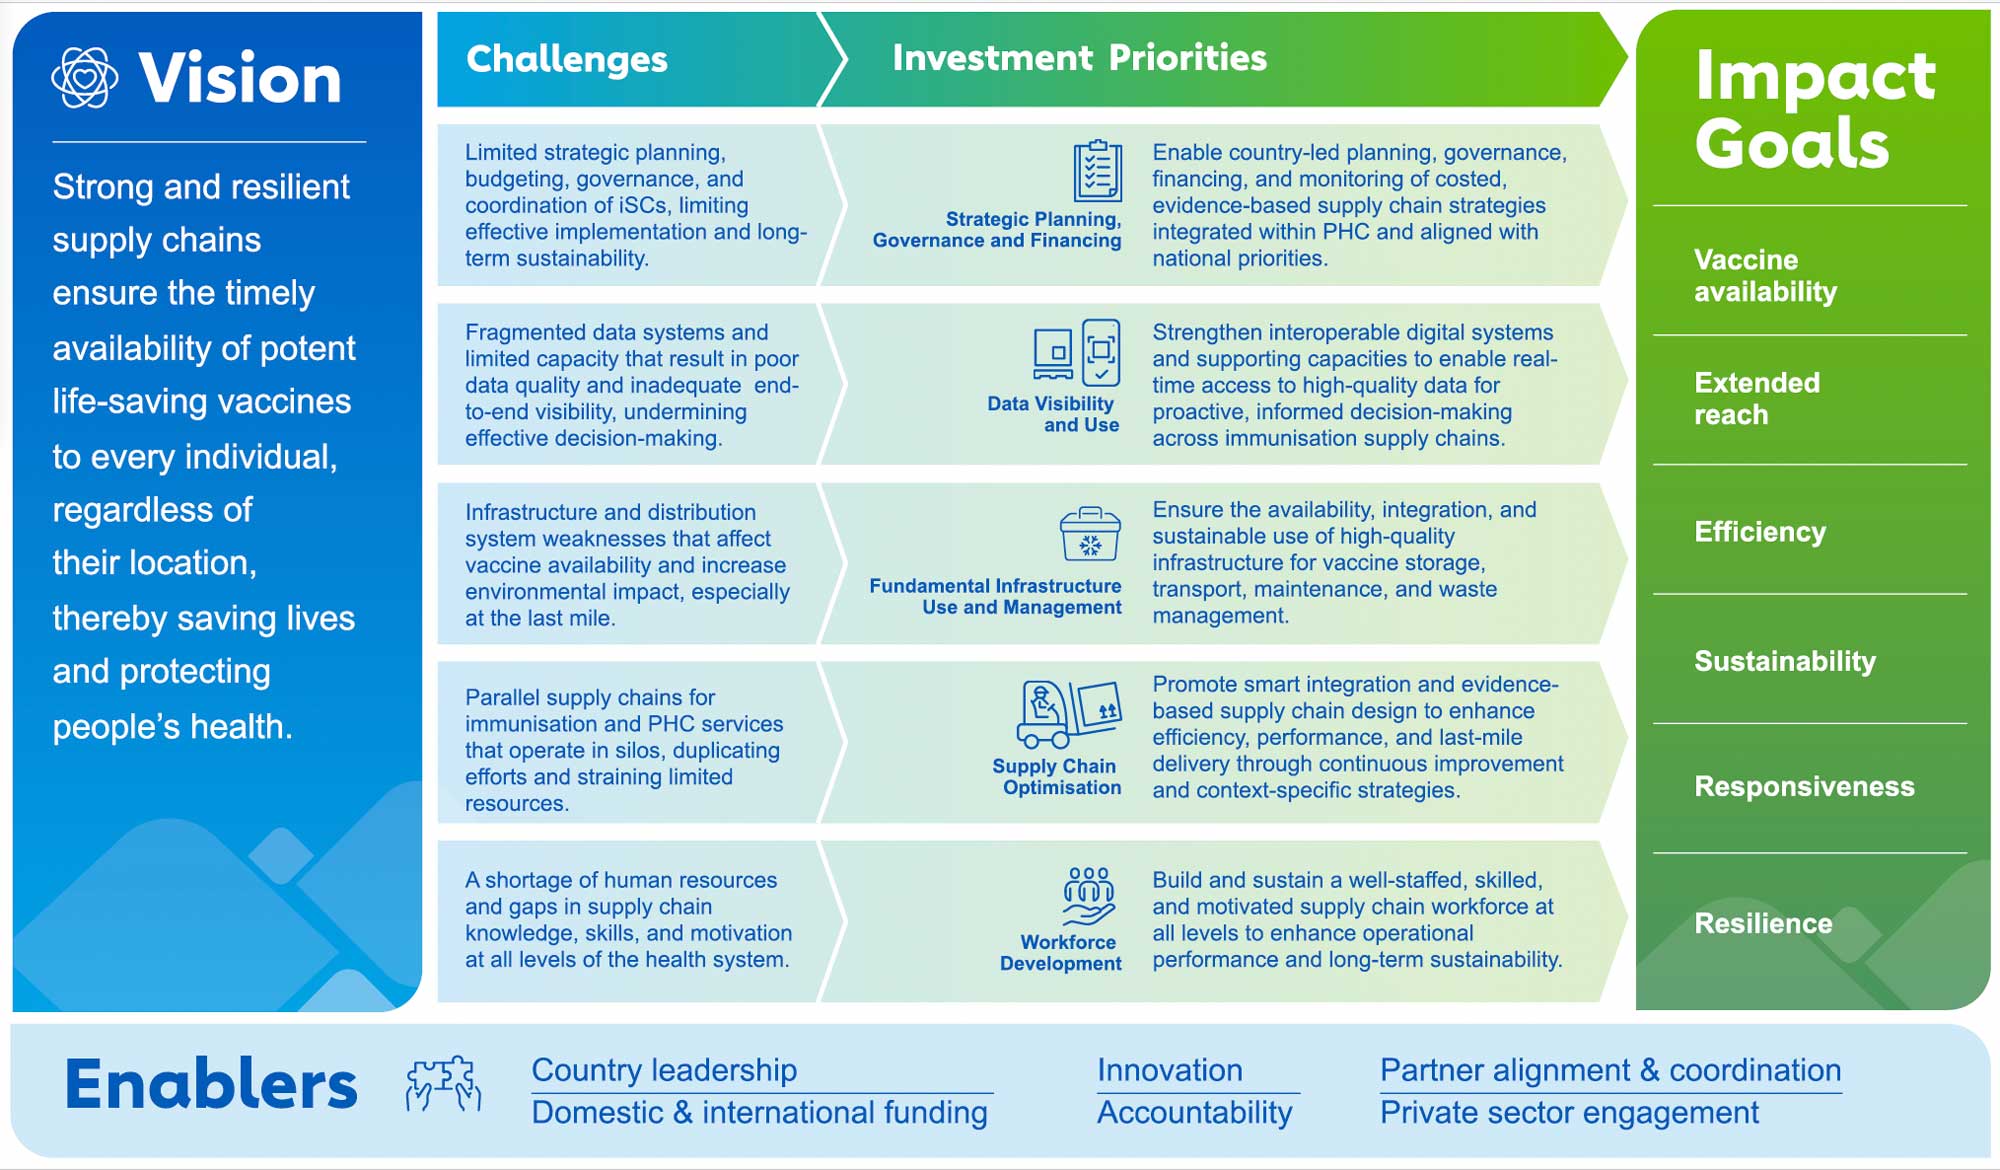
Supporting Gavi immunisation Supply Chain strategy 2026–2030
Next steps

  1. Model at the category level: Aggregate requirements into EVM function-category scores (cold storage, records, SOPs, staffing, funding…).

  2. Test for bottlenecks: Use a decision tree to check if availability needs a critical few requirements together, not each alone.

  3. Connect EVM to wider outcomes: Link EVM with country, UNICEF coverage and other external data to examine how supply-chain performance translates into vaccination outcomes.

  4. Causal evidence: Repeated assessments over time , test whether improving a requirement raises availability.

References

Any questions or comments? 💬

Stage 1: Selecting the requirements

A penalised ordinal (cumulative-logit) lasso on all candidate requirements + population. Availability \(\text{AV}_i\) is one of six ordered bands.

\[ \text{logit}\big(P(\text{AV}_i \ge k)\big) = \beta_{0k} + \sum_{j=1}^{p}\Big( \beta_j R^{\text{s}}_{ij} + \gamma_j R^{\text{I}}_{ij} \Big) + \delta\,\text{Pop}_i \]

Coefficients minimise the penalised likelihood:

\[ \min \; \Big\{ -\ell(\boldsymbol\beta,\boldsymbol\gamma,\delta) + \lambda \sum_{j=1}^{p}\big(|\beta_j| + |\gamma_j|\big) \Big\} \]

  • \(R^{\text{s}}_{ij}\) — score of requirement \(j\) (0–5)
  • \(R^{\text{I}}_{ij}\) — applicability flag (1 = not applicable)
  • \(\text{Pop}_i\)\(\log_{10}\) target population
  • \(\lambda\) — penalty strength (tuned by cross-validation)

What it does

  • The penalty forces most coefficients to exactly zero.
  • Repeated on 1000 bootstrap resamples → each requirement’s selection frequency.
  • Keep those selected in ≥ 60% → shortlist \(\mathcal{S}\).
  • Country is not in Stage 1 (enters only in Stage 2).

Stage 2: Estimating the odds ratios

The shortlist \(\mathcal{S}\) is re-fitted with an unpenalised mixed ordinal model, adding a country random intercept \(u_{c[i]}\):

\[ \text{logit}\big(P(\text{AV}_i \le k)\big) = \theta_k - \sum_{j \in \mathcal{S}}\Big( \beta_j R^{\text{s}}_{ij} + \gamma_j R^{\text{I}}_{ij} \Big) - \delta\,\text{Pop}_i - u_{c[i]} \]

\[ u_c \sim \mathcal{N}\!\big(0,\ \sigma^2_{\text{country}}\big) \]

Reportable effect size — the odds ratio:

\[ \text{OR}_j = e^{\beta_j}, \qquad \text{95\% CI} = e^{\,\beta_j \pm 1.96\,\text{SE}(\beta_j)} \]

  • \(\mathcal{S}\) — requirements kept from Stage 1
  • \(u_{c[i]}\)country random intercept: each country its own baseline availability, drawn from a shared distribution
  • \(\sigma^2_{\text{country}}\) — between-country variance
  • \(\theta_k\) — the five band thresholds

Reading the OR

  • \(\text{OR}_j > 1\) → higher availability
  • \(\text{OR}_j < 1\) → lower availability
  • Far from 1 = strong; interval excluding 1 = statistically clear

We ask the question three ways

Model B — Main

Across all facilities, which requirements are linked to availability?

Adjusts for country context and target population.

Model A — Country check

When facilities are compared within their own country, which requirements still matter?

Removes the possibility that a requirement looks important simply because of its country.

Model C — Size check

What happens when facility size is not used?

Checks whether findings are driven by target population.